How the business model canvas works and when to use it
Porter’s five forces looks at an industry. The business model canvas looks at one company inside it and lays out, on a single page, how that company makes money. Alexander Osterwalder and Yves Pigneur, who created it, define a business model as “the rationale of how an organization creates, delivers, and captures value.”
The two questions are separate: a company can sit in an attractive industry and still run a model that doesn’t work.
A 2004 thesis became a standard through a crowdfunded book and a Stanford class
The canvas started as Osterwalder’s doctoral thesis at the University of Lausanne’s business school, completed in 2004 with Pigneur as his supervisor. Its stated goal was “a managerial tool that allows a firm to easily express its business logic.” The abstract names its “four main pillars” as “product, customer interface, infrastructure and finance,” and a full chapter applies the model to the Montreux Jazz Festival.
A 2010 profile by MaRS says the ideas sat in “a densely-worded PhD thesis. But no one was paying attention.” MaRS describes Osterwalder and Pigneur as “relative unknowns in the business world” for whom the usual publishing route was closed, and quotes Osterwalder: “We couldn’t write a book about business model innovation without having an innovative business model.” What they did instead:
In response, Osterwalder created a community on Ning.com where for $24 people could pay to be a part of the book’s creation. They’d get their name in the book as a “co-creator” and would have first crack at reviewing sections of the book. Participants contributed re-writes, case studies and design suggestions that made the book the best it could be.
“Who would have thought people would pay to write a book?” says Osterwalder. And pay they did. At a price-point of $24, they quickly gathered together a community of 100 people. So they doubled the price and even more people bought in. The price eventually rose to $243 and two people still bought in.
The self-published Business Model Generation came out in 2009 with 470 co-creators from 45 countries named on its inside cover. According to MaRS, its first 5,000 copies sold out through Amazon, and Wiley signed it for global distribution. Wiley’s edition followed in July 2010, the same year Osterwalder co-founded Strategyzer to sell software and training built on the canvas.
In January 2011 Steve Blank and his co-teachers introduced the Lean LaunchPad class at Stanford, with a lecture each week on one of the nine blocks. In a December 2011 comment on his blog, Blank wrote that he and Ann Miura-ko, who taught the class with him, had “a bunch of gripes” about how Osterwalder defined Value Proposition and Customer Relationships, but that “those downsides were far outweighed by teaching what was fast becoming a standard.”
Blank also taught the National Science Foundation’s I-Corps, which launched in 2011 to help scientists judge whether their research could become a business, and the post that comment sits under describes its first 21 teams presenting their canvases in the second class. The NIH started its own I-Corps in the fall of 2014, where participants fill in a canvas from what they learn in customer interviews.
The right side of the canvas brings in revenue and the left side creates cost
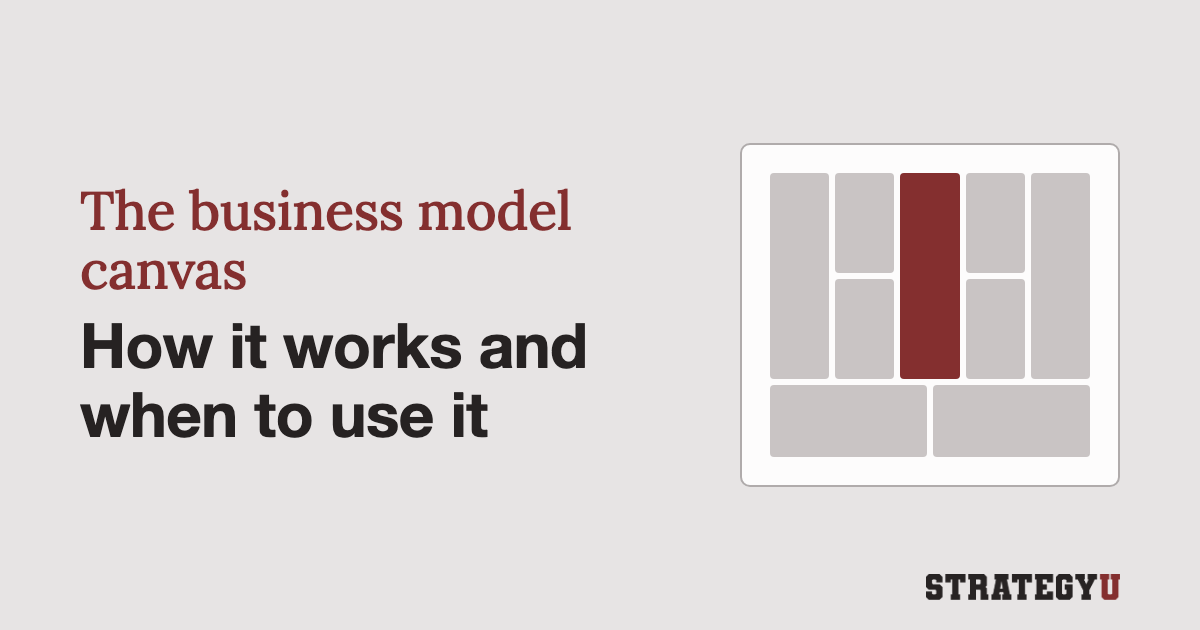
Business Model Generation says a business model “can best be described through nine basic building blocks that show the logic of how a company intends to make money.” The layout puts the customer on the right, the offer in the middle, the operation that delivers it on the left, and the money along the bottom. Osterwalder explained the arrangement in the same 2011 comment thread on Blank’s blog:
The bottom line of the Business Model Canvas is an outcome of the 7 building blocks above. The building blocks on the right hand side of the BM Canvas are value drivers and lead to revenues. The building blocks on the left hand side of the BM Canvas are cost drivers and lead to costs.
The diagram follows the canvas in Business Model Generation, with Osterwalder’s side labels from that comment and each block’s question from the list below.
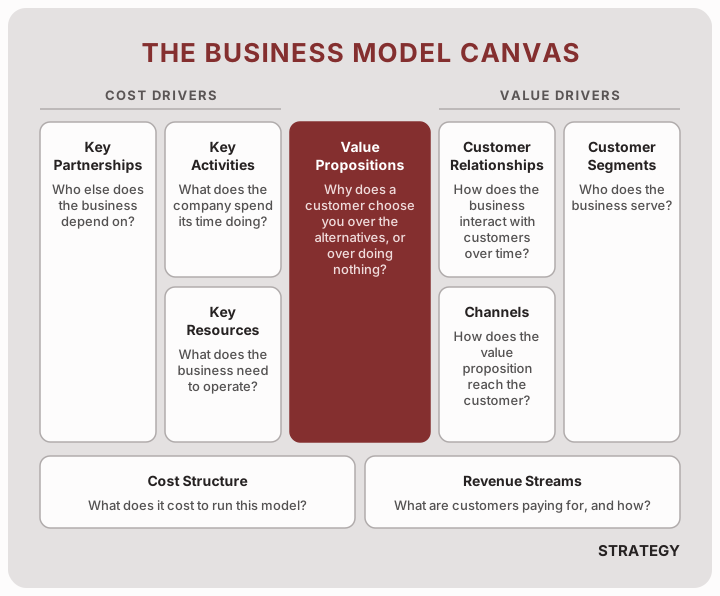
Customer Segments. Who does the business serve? A company might focus on one group of buyers or, in the case of a platform, serve several groups whose needs differ.
Value Propositions. Why does a customer choose you over the alternatives, or over doing nothing? The answer might be price, speed, a better product, something nobody else offers, or making a painful process less painful.
Channels. How does the value proposition reach the customer? This covers how people first hear about you, how they buy, how they receive what they bought, and how they get help afterward. It might be a sales team, a website, a retail partner, an app, or some combination.
Customer Relationships. How does the business interact with customers over time? At one end is a dedicated person for each account; at the other is pure self-service.
Revenue Streams. What are customers paying for, and how? It could be subscriptions, transaction fees, one-time sales, licensing, or advertising. A company can run more than one at a time, as Netflix does by selling advertising on its cheaper ad-supported plan as well as charging subscriptions.
Key Resources. What does the business need to operate? Equipment, facilities, and inventory, but also proprietary technology, specialized people, a brand, or access to capital.
Key Activities. What does the company spend its time doing? For a software company that’s building and maintaining the product. For a retailer it’s buying, merchandising, and moving stock.
Key Partnerships. Who else does the business depend on? Suppliers, manufacturers, distributors, technology providers, and anyone else doing work the company has chosen not to do itself.
Cost Structure. What does it cost to run this model? Business Model Generation separates cost-driven models, with no-frills airlines (Southwest, easyJet, Ryanair) as its example, from value-driven ones like luxury hotels, and adds that “many business models fall in between these two extremes.”
Filled in for real companies, the canvas shows what a one-line description hides
Airbnb’s hosts supply the homes and now pay the whole fee
Airbnb has two customer segments: hosts who want income from space they already have, and guests who want somewhere to stay other than a hotel. Each gets a different value proposition. Hosts get bookings, payments, and insurance. Guests get a wider choice of places to stay, with reviews to judge them by. The app is the channel for both.
Revenue is a service fee on each booking, and who pays it is a design choice. Under Airbnb’s split-fee structure, most hosts pay 3% and guests pay between 14.1% and 16.5%. Airbnb is now moving hosts to a single 15.5% fee paid entirely by the host, and the same help page says the single fee “is mandatory for most hosts.” Airbnb’s announcement gives an example: a host who listed at $100 used to show guests $115 and keep $97. Under the single fee the host lists at $115, which is also what guests pay, and still keeps $97, so Airbnb’s cut is now built into the listed price.
On the left side, the resources are the platform, the brand, and the review history. The activities include product development, trust and safety, and dealing with city regulators; Airbnb’s 2025 10-K notes that “the City of New York has effectively banned short-term rentals.” Partners include payment processors, the photographers it connects to hosts, and the insurers behind its host liability cover, which in most jurisdictions is Zurich.
The resource the model depends on most isn’t on that list, because the hosts own it: the 10-K describes hosts listing “their homes, experiences, and services.” In 2025 Airbnb’s two largest cost lines were sales and marketing ($2.6 billion) and product development ($2.4 billion), on revenue of $12.2 billion.
Netflix kept three things from its DVD business and replaced the rest
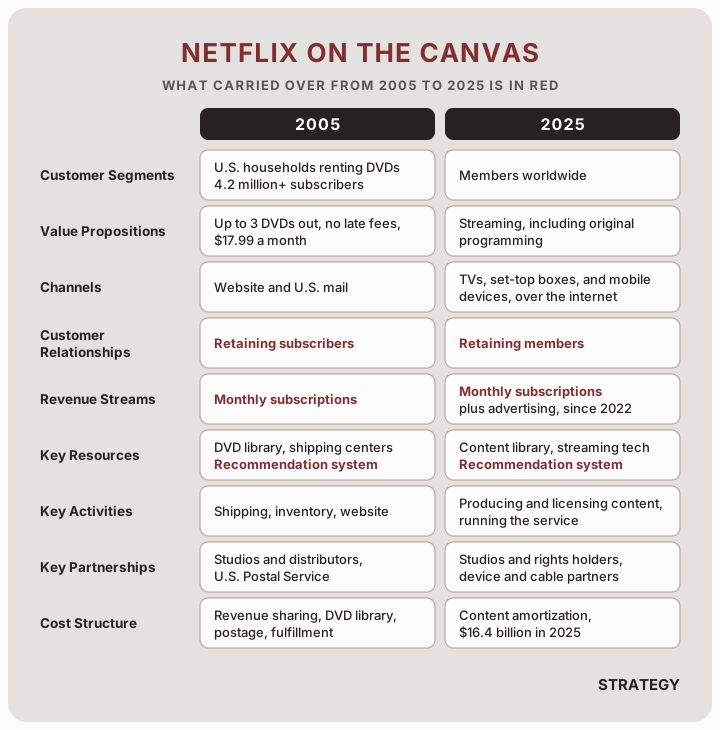
In 2005 Netflix served U.S. households that wanted to watch movies at home without a trip to the video store. Its 10-K for that year described its most popular plan as “up to three titles out at the same time with no due dates, late fees or shipping charges for $17.99 per month.” The channels were the website and the mail.
The resources were the DVD library, content licenses, the recommendation system, and a network of shipping centers, 30 of them at the end of 2004. The company spent its time on logistics, inventory management, and the website. Revenue came from monthly subscriptions, and the company ended 2005 with 4.2 million subscribers.
In 2025 the members are worldwide, the product is streaming and original programming, and the channel is the internet, to phones, TVs, and set-top boxes. The resource that matters most is the content: Netflix added $17.1 billion of content assets in 2025, up from $12.6 billion in 2023. The activities moved from logistics to producing and licensing shows and running a streaming service. Advertising became a revenue stream in November 2022, when Netflix launched an ad-supported US plan at $6.99 a month.
Put the two canvases side by side and three things carry over: the subscription, the recommendation system, and the work of keeping members from leaving, which both filings name as a risk. The shipping centers, the postal channel, and the inventory management are gone.
Zara pays for proximity, and Inditex turns its stock almost twice as fast as H&M
Zara’s right side is ordinary: it sells current styles at moderate prices to shoppers in its stores and online, and the relationship is transactional.
A November 2004 Harvard Business Review article by Kasra Ferdows, Michael Lewis, and Jose Machuca made the case for speed, and HBR’s summary of it says “Zara can design, produce, and deliver a new garment to its 600-plus stores worldwide in a mere 15 days.” Zara had 1,500 stores at the end of its 2025 fiscal year. Inditex, Zara’s parent, says in its FAQ that “To be quick is not as important as being honestly close to customers’ demands,” and the only lead time it publishes is for delivery: an average of 36 hours from a distribution center to a store in Europe, and up to 48 hours to stores in America or Asia.
On the left side, HBR’s 2004 summary said Zara kept “almost half of its production in-house.” Inditex’s FAQ says its own factories focus on garments with “a greater fashion component,” and that “Last year we worked with 1,790 direct suppliers in 44 markets who in turn used 8,756 factories.”
Half of Inditex’s finished-goods manufacturers are, in its words, “located close to our headquarters in Arteixo, mainly in Spain, Portugal, Turkey and Morocco,” and Inditex says each new design is ordered a few thousand units at a time. More than 700 designers, in the FAQ’s words, use “the customers themselves as principal sources of inspiration, through the information received from the stores.” Inditex’s 2024 annual accounts list its logistics centers in Arteixo, A Laracha, Tordera, and Zaragoza.
HBR’s summary of the 2004 article opens with the costs this approach accepts:
Would you send a half-empty truck across Europe or pay to airfreight coats to Japan twice a week? Would you move unsold items out of your shop after only two weeks? Would you run your factories just during the day shift? Is this any way to run an efficient supply chain? For Spanish clothier Zara it is.
On each company’s own FY2025 figures, Inditex turned its inventory about 5.1 times against H&M’s 2.8, roughly 72 days of stock against 130. Gross margin, as each reports it: 58.3% against 53.4%. The turn ratios are from reported cost of sales and stock, not direct figures either company publishes. Inditex’s numbers cover all its brands, and Zara, Zara Home, and Lefties together made up 70% of its 2025 sales.
Fill in the customer side first, as a group, and compare two canvases
Work through the blocks in the book’s order, customers first
Business Model Generation numbers the blocks from the customer inward. Customer Segments, Value Propositions, Channels, Customer Relationships, and Revenue Streams come first, then Key Resources, Key Activities, Key Partnerships, and Cost Structure. Working in that order means every resource and activity on the left has to serve something already written on the right.
Fill it in on a wall with the people who will disagree
Osterwalder and Pigneur write that the canvas “works best when printed out on a large surface so groups of people can jointly start sketching and discussing business model elements.” The arguments are the useful part: which customer segment matters most, or whether a resource is really proprietary or just something the company happens to own.
Compare it with a competitor, a proposed change, or an earlier year
Map your model next to a competitor’s and look for the blocks that differ. Or fill in one canvas for the business as it runs now and another for a proposed change, such as a new customer segment, and see which other blocks the change forces: new channels, different activities, a different cost structure. Or compare the same company in two different years, as with Netflix above.
Use it to design or explain a model, and use value chain analysis to cut cost
The canvas works for laying out the assumptions behind a venture that doesn’t exist yet, for sketching a different way an existing business could make money, and for explaining a business to someone who doesn’t know it. It doesn’t help much when the model is sound and the problem is execution. For taking cost out, the Cost Structure block gives you categories, not a plan, and the work belongs in value chain analysis.
The canvas leaves out competitors, profit, and time, and it assumes a paying customer
A canvas for a business with three close competitors can look the same as one for a monopoly, and if you’re deciding whether to enter a market, that’s the question you most need answered.
Ash Maurya, who adapted the canvas for startups as the Lean Canvas, added a box for competition. He calls it Unfair Advantage and describes it as “another name for competitive advantage or barriers to entry often found in a business plan.” He added Problem, Solution, and Key Metrics too, and took out Key Activities, Key Resources, Customer Relationships, and Key Partners to make room. Osterwalder disagreed in the comment thread on Blank’s blog, arguing that “an ‘unfair advantage’ is a characteristic/attribute of a Value Proposition and as such not a business model building block.”
Revenue Streams says what customers pay for and Cost Structure says what the company spends on, but the page has no margin, no unit economics, and no cash flow, so a model that reads cleanly on the wall can still lose money on every sale.
The canvas also shows a business at one moment. When Maurya first read the book, he noted that its examples showed companies like Apple and Skype “after they were successful.” Netflix needed two canvases, and nothing on either one shows how the company got from the first to the second.
The blocks assume a commercial business, too. In a 2016 post introducing the Mission Model Canvas, which he and Osterwalder put forward for Stanford’s new Hacking for Defense course, Blank wrote that for government and military organizations “the canvas box labeled Revenue Streams doesn’t make sense.” The new canvas replaces it with Mission Achievement, renames Customer Segments as Beneficiaries, and swaps three more blocks for Mission Cost/Budget, Deployment, and Buy-in/Support. A nonprofit whose funders aren’t the people it serves runs into the same problem.
Testing and defending a model take tools the canvas doesn’t have
Testing a model means taking it to customers, which is what Blank’s students and the I-Corps teams did with theirs. Defending it takes industry analysis, checking that it makes money takes unit economics, and breaking either question into parts you can answer is what an issue tree is for.
When your canvas is on the wall, ask which of the nine blocks a competitor would struggle to copy within a year.