Ghost deck: how consultants write the presentation before the analysis
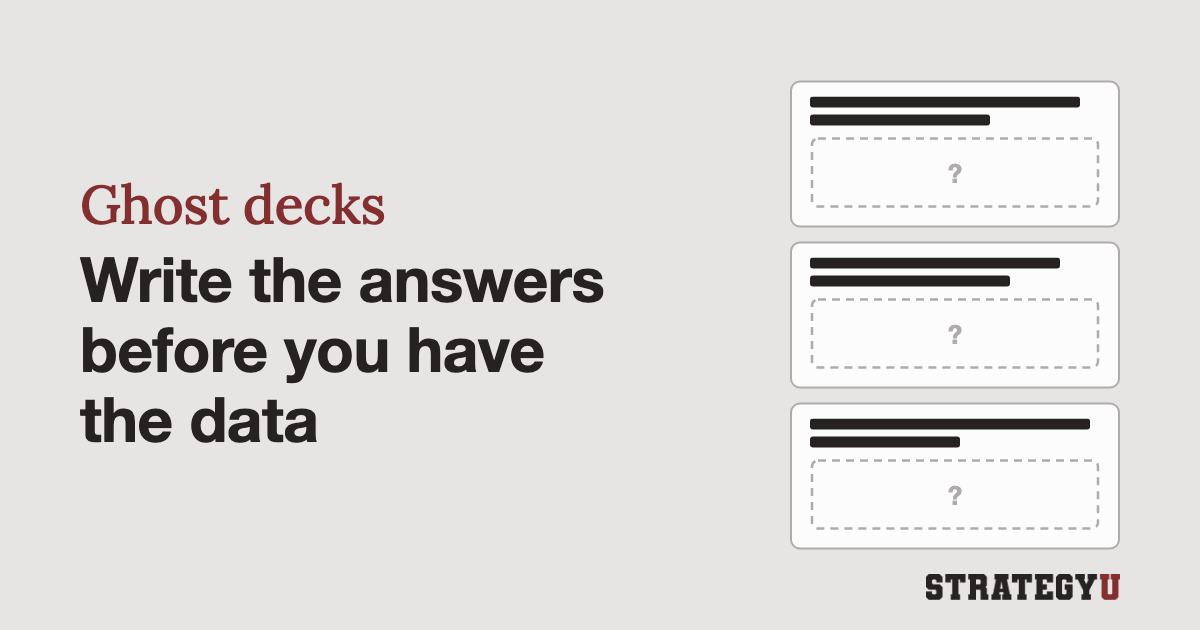
A ghost deck is a presentation written before you’ve done any of the work. Each page is a question you intend to ask and a sketch of the analysis that would answer it. This sort of deck has two purposes:
- Help align the team around a problem and project approach
- Help jump to the finish line to see where the initial project direction might lead, so you can work backward and see where the holes are
The first time I did a ghost deck was in Basic Consulting Readiness (BCR) training at McKinsey. It was uncomfortable because in the past I had always been an eager bottom-up analyst. I didn’t want to plan the high level. I loved just figuring it out as I went. But as we scoped out the mock project, developed hypotheses, and then split up the workstreams, I started to see why this was so valuable, especially in team projects.
In a ghost chart, the title is typically a hypothesis, question, or answer to that question
Paul Friga, a former McKinsey consultant, calls the individual pages “ghost charts”1 in The McKinsey Engagement and defines one this way:
It is basically a draft slide that is used to capture ideas at an early stage in the problem-solving process. It comprises a title (usually at the top of the slide), a data label, and the data (or a sketch of what the data will be once collected). The most important part of the ghost slide, and the only part that should reflect any substantial amount of “analytical energy,” is the title of the slide.
He adds that the title “is in sentence format, and it states the insight—the ‘so what’—of the slide.” So for example, let’s say you hypothesize that if you bring chocolate for your team, 100% of the team will be happy about this. You might whip up a slide that looks like this:
![A ghost slide titled "Bringing chocolate will make 100% of the team happy," with a sketched bar chart comparing the share of the team that is happy with no chocolate ([X]%) and with chocolate (100%), and a note that the data will come from a team poll](/images/blog/ghost-deck/chocolate-ghost-slide.svg)
Build it from your issue tree, with a page for each hypothesis
A good first step before the ghost deck is an issue tree. Here’s a quick example, more detailed than the chocolate one.
Take a hypothetical grocery chain asking whether it should launch its own delivery service. The tree breaks the question into three hypotheses: customers want delivery, the company can deliver at a profit, and building its own service beats partnering with an existing one.
Each hypothesis becomes a page, plus a summary page up front that states the recommendation:
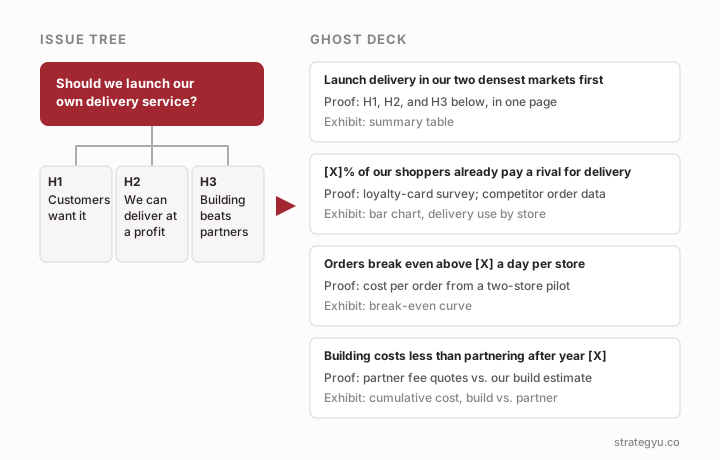
Each title is a full sentence, even where the number isn’t known yet. “[X]% of our shoppers already pay a rival for delivery” commits you to a claim and tells you exactly what to measure, while “Customer demand for delivery” commits you to nothing.
While bottom-up people who love to dive straight into the data (ahem, me) might be driven crazy by these loose estimates and judgments, a ghost deck can be a very valuable early part of any project.
On each slide you can either fill in an example chart or just list out some quick bullets: additional questions, or the data and answers that will prove the title. This is what I call vertical flow: the title states the takeaway and everything below it exists to support it.
In a ghost deck those bullets double as a data request: a loyalty-card survey, competitor order data, cost per order from a two-store pilot. You can compile these and share them with the client (with your higher-level questions if appropriate).
A ghost deck gave one struggling McKinsey team its data plan
Brigham Frandsen, a McKinsey associate, describes in Friga’s book a study that started badly.
The team was assembled in a hurry to repeat a sales program for a bank affiliate. It had no engagement manager, and the partner only showed up the day before the first steering committee. As Frandsen tells it, they “gathered everything and anything that we could get,” which ended in an all-nighter before a meeting that “by all accounts didn’t go so well anyway.”
The recovery started with a team meeting and two associate partners who had run similar studies. Then came the ghost deck:
Within a couple of days, we had a complete framework combining lean banking with sales improvement, and we had the chapters “ghosted” out for the packs for the next two steering committee meetings and the final product, based on that framework. I then took the chapters that I was assigned and literally wrote out all the slides that I would need, complete with titles and ghost charts. In the process of doing this, we were able to clarify the key goals and develop a plan for gathering data, deploying the client team, and getting results.
Early on, as he puts it, “we had no direction for what data to collect.” He calls having the ghosted chapters done “extremely empowering for the rest of the study,” and the project ended as one of his most rewarding at McKinsey.
Teams skip it because it feels like you are making stuff up
Friga names the biggest obstacle directly:
The biggest problem consultants have with creating ghost charts is their reluctance to document their ideas without thorough data collection and analysis.
This is very hard for people who are in consulting because they LOVE the data (me included).
In my personal experience, this tendency was much worse at BCG, where it seemed like gathering more data was rewarded. At McKinsey, managers and partners were much more focused on the high-level story.
Once the data is in, the ghost titles become action titles
The ghost deck is finished when every title has been tested. But in my experience, these decks rarely align perfectly with the finished product. Projects go through bottom-up and top-down iterations, and after each loop the problem, the hypotheses, and the analysis get refined. The titles that hold up become the action titles of the final deck.
Next time you start a project, before you open a spreadsheet, ask: what would the final deck say if my hypotheses are right, and what would I need to see to know they’re wrong?
Footnotes
The McKinsey Mind calls the project-level version a “ghost pack.” Barbara Minto’s storyboarding in The Pyramid Principle is similar, but it starts from a finished pyramid rather than from hypotheses. ↩